Session Details
Host: Peter Parker from Network Planner, Western Metropolitan, Transport for Victoria
Room: Yarra
Format: Presentation
No. of attendees: 25
Scribe: James Reynolds
Public Transport Analogy
Public transport has similarity to a gate from your residence onto the street that opens only once every x minutes. If the gate opens every 60 minutes then it is very inconvenient, and it is difficult to leave your house. Similarly for a 60 minute frequency transit service. However, if the gate opens every 2 minutes (a very frequent transit service), then it is not really an inconvenience.
What is the issue with public transit systems?
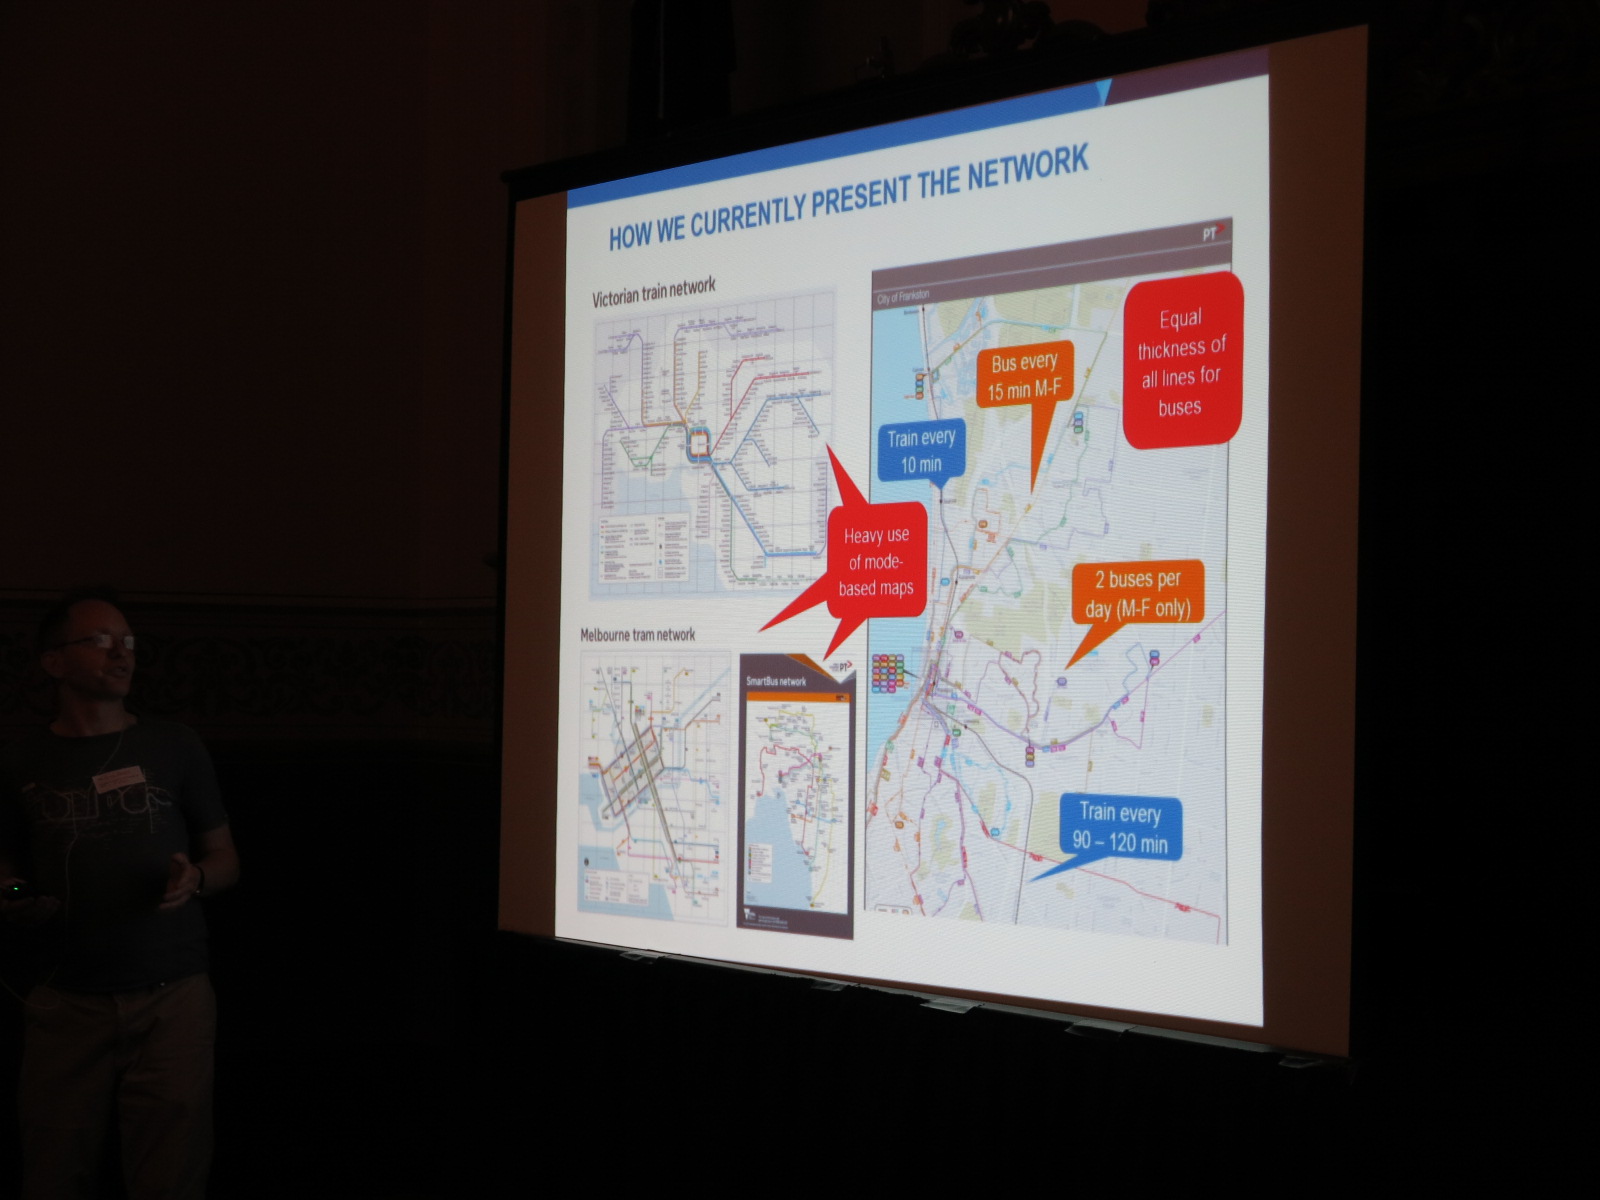
Public transit system maps typically show routes, not frequency. For example, the transit map for Frankston shows a route with 2 services a day in the same line time as a Smart Bus service with services every 10-20 minutes.
What is the current transit system in Melbourne?
Visualising the Melbourne transit routes that have headways of 10 minutes or less (turn up and go) shows:
Much of the tram network
CBD to Fankston, Dandenong, City loop, Footscray and Newport on the train network
Selected bus routes (ie Monash 601 shuttle)
It is a limited network, and passengers must interchange in the city.
How could the public transport system be improved?
Visualising the Melbourne transit network routes that have headways of 15 minutes or less (weekdays) adds:
- Trains to ringwood and Sandringham
- Smartbus routes
- All of the tram network
The network covers all of the inner areas, much of the middle suburbs and includes both radial services (tram and train) and crosstown Smartbus routes.
Thinking about the transit network in terms of frequency may provide a better communication tool than traditional maps separated by mode (eg. current train, tram and bus network maps). This could improve public’s ability to understand where they can get to easily on the network, particularly on bus services.
Which parts of Melbourne have a 20 minute network?
The 20 minute network (check timetable, but still fairly frequent) covers most of the train network (notable exceptions Lillydale and Belgrave), the tram network, SmartBus network and various local bus routes.
New minimum standards for bus routes and new approaches in the last couple of years adopts some of this approach, by seeking to provide a 20 minute network, as well as into the evenings. Recent service upgrades have also sought to harmonise the bus and train frequencies, particular in outer areas.
Conclusions
- “Service levels are key to useful public transport
- Think of the network in terms of service, not just infrastructure
- Start by building your mental map of network service levels
Look at route maps at ptv.vic.gov.au
Look at timetables, noting hours and frequencies”
Question and Answer Session
Nick from Melbourne City Council: Will people really make a change from the car to (bus based) transit based on better mapping? Or is it more that trams are more popular because of the tram tracker app, ease of travel, better services?
Response: Something like a map is a way of taking the mystery out of the bus network, and increase the general public knowledge of (higher frequency) bus routes.
Bridget from the City of Casey: A lot of green field development in the outer areas has little to no bus service. Is it better to focus on coverage (social access) vs frequency?
Response: This is a challenge for bus planning, and we would end up with very different networks if we focused on either one or the other. This is a larger choice for society and the answer is somewhere in between, with a mix of objectives to balance access and frequency.
Carl from the City of Ballarat: is it to do with trams and trains having fixed infrastructure, giving passengers confidence about where the transit service is (and will stay)?
Response: Some ways of increasing physical presence of bus routes, ie. SmartBus branding at stops. Other examples (from room) include the MUNI bus system in San Francisco.
Chris Loader from TFV: comment about tram apps - the PTV app gives realtime information for all modes. There’s a distinction between journey planner app information (how do I get there now!) vs the consistent frequency network of how they can get around in their network.
Ian Hopkins from Yarra trams: comment about how network analysis has shown that one of the best things to do for the tram network would be to increase frequencies on perpendicular bus routes. And that there are many more interchanges between public transport (ie. on the street) than we typically consider (ie. major infrastructure projects).

